



QUICK ANSWER The Tipeshwar tiger survey, run by the Wildlife Institute of India in 2021, placed 62 camera-trap pairs across the 148.63 sq km Tipeshwar Wildlife Sanctuary for 30 days. It estimated about 7 tigers and 4 leopards per 100 sq km, roughly 11 tigers and 6 leopards, and found nilgai and chital the most-seen prey. Tipeshwar is a sanctuary, not a tiger reserve.
Key Takeaways
- The survey estimated tiger density at 7.07 per 100 sq km, which works out to roughly one tiger for every 14 sq km, and about 11 tigers in the whole sanctuary.
- Leopard density came out at 3.86 per 100 sq km, about 6 animals, so the survey found more tigers than leopards in this sanctuary.
- Nilgai were the most-seen prey, with 50 sightings. Chital had the highest estimated density, about 9.5 per sq km.
- Camera traps also recorded sloth bear, dhole, Indian wolf, jungle cat and ratel (honey badger), all backed by camera-trap records.
- These are 2021 figures from a 30-day window with wide margins of error. Treat every number as a dated estimate, not a headcount.
The Tipeshwar Tiger Survey: A Census Made of Cameras
The Tipeshwar tiger survey of 2021 put 62 pairs of camera traps on tree trunks at knee height and left them running for thirty nights. The Wildlife Institute of India ran it, and it is the closest thing this forest has to a census. If you are planning a visit, our travel guide to Tipeshwar covers the practical side. This page covers the science: how many tigers and leopards Tipeshwar Wildlife Sanctuary holds, what shares the forest with them, and what the numbers cannot tell you.
Tipeshwar is small. The sanctuary covers 148.63 sq km in Pandharkawada tehsil of Yavatmal district, close to the Telangana border. Small places are easy to romanticise and hard to measure, which is why a proper survey matters.
How the Survey Worked
The Wildlife Institute of India ran this as the fourth phase of a long-term programme monitoring tigers, co-predators and prey across Vidarbha, working with the Maharashtra Forest Department. Two methods did the work.
Camera traps for predators. The team set 62 camera stations on a grid of 2 sq km cells. Each station held two cameras facing each other, so both flanks of an animal were photographed. Over 30 days they logged 2,206 trap nights of data. Tigers were told apart by stripe pattern and leopards by rosette pattern, much as a fingerprint identifies a person.
Walked transects for prey. The team laid 13 transects of 2 km each and walked every one seven times, 182 km in total. That produced 112 sightings of herbivores.
To turn photographs into a density, the report uses a method called spatially explicit capture-recapture. In plain terms, it looks at where and how often each identified animal was photographed and works backwards to how many animals must live in the area.
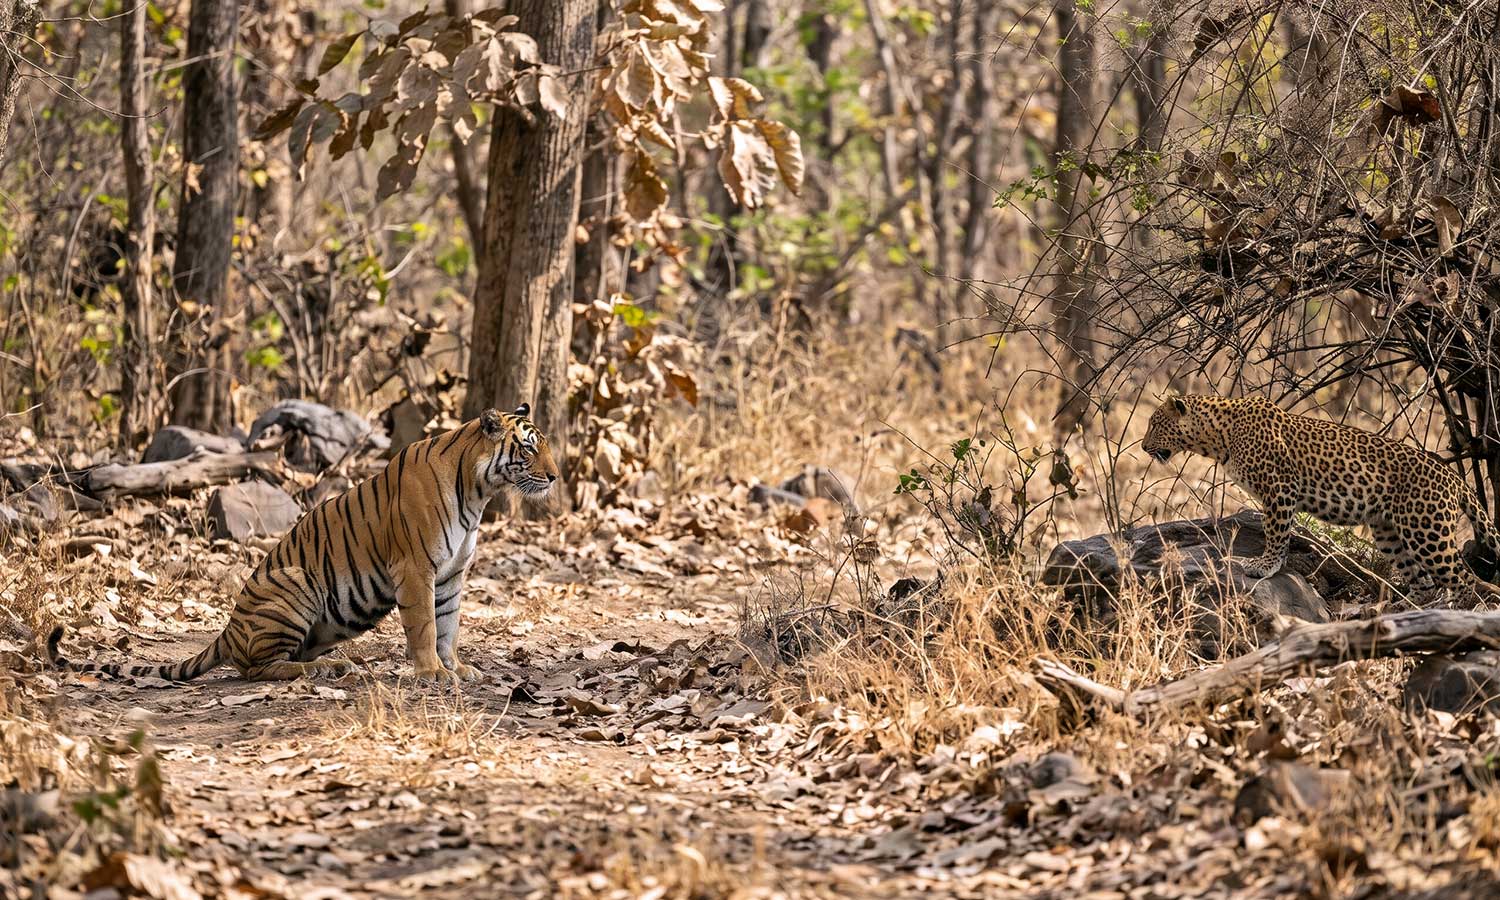
Tigers and Leopards: The Headline Numbers
Here is what the camera traps produced, with the 2020 figures from the previous phase alongside.
| Density per 100 sq km (2021) | Density in 2020 | Estimated animals | Range the report gives | |
| Tiger | 7.07 | 6.18 | 11 (range 11 to 14) | Density 3.9 to 12.7 per 100 sq km |
| Leopard | 3.86 | 2.39 | 6 (range 5 to 10) | Density 1.7 to 8.6 per 100 sq km |
The tiger figure of 7.07 per 100 sq km translates to about one tiger for every 14 sq km, and the leopard figure to about one for every 26 sq km. The report estimates 11 tigers and 6 leopards for the whole sanctuary.
Read the ranges as carefully as the headline. The tiger density could sit anywhere from 3.9 to 12.7 per 100 sq km on the report’s own confidence interval, and the 2020 and 2021 intervals overlap, so the rise from 6.18 to 7.07 is suggestive rather than proof of growth. It is still a useful baseline. A forest that holds a stable population of both big cats in 148 sq km has a healthy base of prey underneath.
Who Else Was on Camera
Tigers and leopards were not the only animals the traps recorded. For field notes on the quieter residents, see our guide to the overlooked species of Tipeshwar, and the profile of sloth bears, a species the camera traps mapped separately.
Beyond that, The report maps where camera-trap activity was concentrated for sloth bear, jungle cat, ratel (the honey badger), dhole and Indian wolf, alongside nilgai, wild boar, chital, sambar and four-horned antelope.
The report’s species introduction names a few more residents: striped hyaena, golden jackal, Bengal fox and pangolin. None of those four appears in its camera-trap maps, so treat them as listed rather than photographed in this survey. The same introduction counts about 29 mammal species, around 180 birds and 26 reptiles in the sanctuary.
Each of these has its own profile: chital deer, striped hyena in India, the Indian wolf, honey badger in India, the jungle cat and the langur monkey.
A caution for visitors. Camera traps work all night and in every corner of the forest. A wolf or a ratel on a camera trap is a different thing from a wolf or a ratel in front of a jeep. These are real residents and very unlikely sightings.
What the Prey Numbers Say
The transect walks give the best picture of what is on the menu.
| Species | Sightings on transects | Individuals counted |
| Nilgai | 50 | 145 |
| Chital | 27 | 99 |
| Langur | 8 | 50 |
| Peafowl | 11 | 24 |
| Blackbuck | 4 | 16 |
| Four-horned antelope (chousingha) | 5 | 8 |
| Wild boar | 3 | 7 |
| Chinkara | 2 | 4 |
| Sambar | 1 | 1 |
| Indian hare | 1 | 1 |
Nilgai were seen most often, but chital had the higher estimated density at about 9.5 per sq km, against about 6 for nilgai. The overall prey density works out at roughly 17.6 animals per sq km. The report states it as 17.56 in its density table and 17.82 in its summary, so we round it.
The comparison with 2020 is striking. Chital density was about 1.7 per sq km in the earlier phase and about 9.5 in 2021, while nilgai fell from about 10 to about 6. The report does not explain the swing, and with 27 chital and 50 nilgai sightings behind the figures, small samples can move numbers a long way. Take it as a sign of a changing prey base, not a settled trend.
Sambar is the quiet number in the table: one sighting, one animal, in 182 km of walking. The report could not estimate the density of sambar, chousingha, chinkara, blackbuck, langur, wild boar, hare or peafowl because there were too few sightings. That does not mean they are absent. It means this method saw them too rarely to count.
Who Is Awake When
Camera traps stamp every photograph with a time, which lets researchers see which animals keep the same hours. The report scores overlap from 0, never active together, to 1, identical activity. It treats high overlap as a sign of either predation or competition.
| Pair | Activity overlap (0 to 1) | How to read it |
| Dhole and wolf | 0.81 | The most closely matched pair in the report |
| Tiger and wild boar | 0.79 | Active at very similar hours |
| Tiger and chital | 0.78 | The report calls chital one of the tiger’s main prey |
| Tiger and wolf | 0.73 | High overlap |
| Tiger and dhole | 0.72 | High overlap |
| Leopard and hare | 0.70 | The leopard’s highest overlap with any prey |
| Leopard and sloth bear | 0.70 | Similar hours |
| Tiger and leopard | 0.56 | Noticeably less overlap than tiger with dhole or wolf |
| Leopard and chital | 0.38 | Little shared activity time |
Tigers keep hours very close to chital and wild boar. Leopards share most of their active time with hares and sloth bears, and very little with chital. Dholes and wolves, two pack animals, are the most closely matched pair of all. The report describes these patterns without drawing firm conclusions, and so do we.
What the Survey Cannot Tell You
- It is a snapshot. The camera traps ran for 30 days in 2021, and a population can look different five years later.
- The margins are wide. Density ranges of 3.9 to 12.7 for tigers mean the single headline number should never be quoted without its year.
- Other counts exist. Later reports and other methods give different tiger figures, often higher. They are not directly comparable, because the dates, areas and methods differ.
- It measured prey, not diet. The report describes scat analysis as a method but gives no diet results, so we can say what was available to tigers, not what they ate.
- Presence is not a promise. A species on a camera-trap map is not a species on your safari checklist.
What This Means for Your Visit
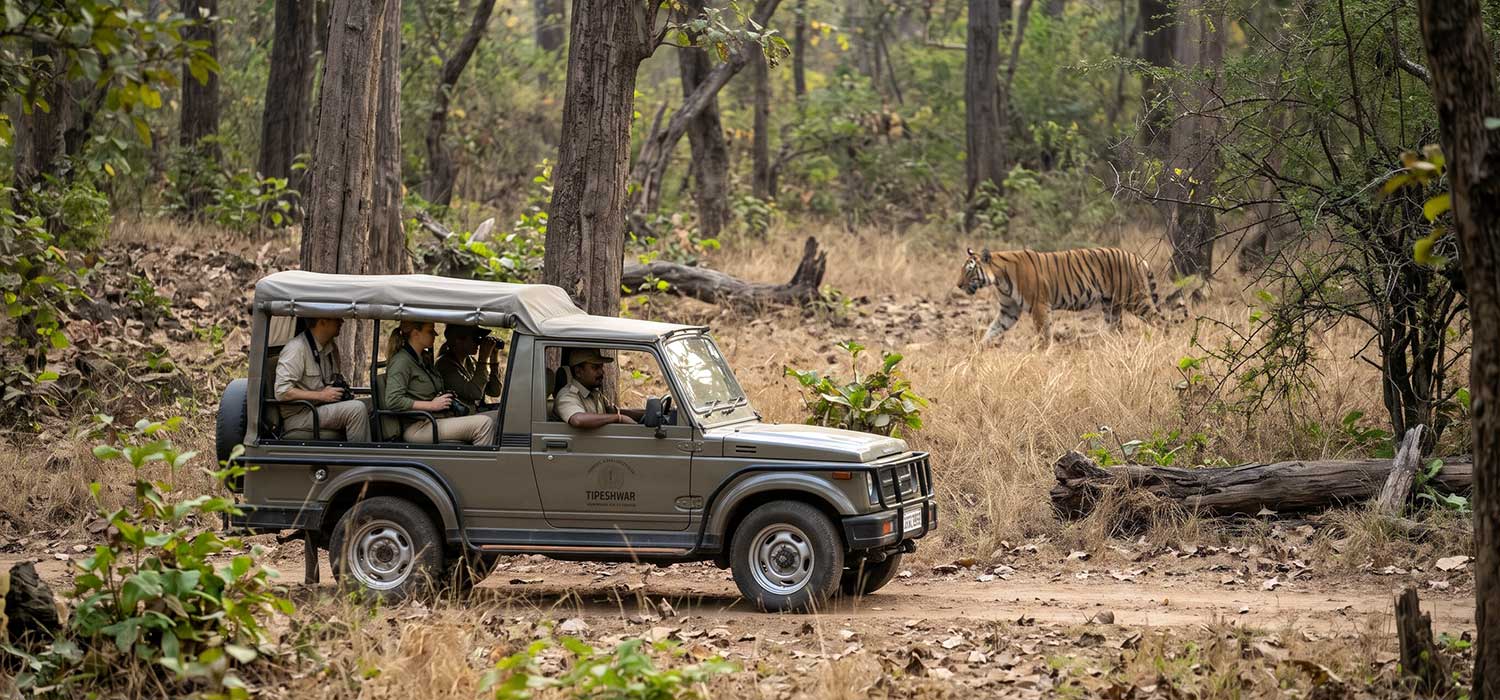
The data predicts your first sightings. Expect nilgai, chital, langurs and peafowl to make up most of what you see on a morning drive, with tigers and leopards as a hope rather than an expectation. That is how it works in a small forest with a healthy predator base, and it is why naturalists read signs as much as they scan for animals.
It also explains why a patient jeep beats a fast one. With about one tiger per 14 sq km spread across 148 sq km, a private safari removes the incentive to chase a crowd and lets your naturalist hold still at a likely spot. To learn what that naturalist is reading, see reading a tiger before you see it. If you want a base inside the forest edge, see our guide on where to stay in Tipeshwar, or look at the villas at Tipai.
Frequently Asked Questions
How many tigers are in Tipeshwar Wildlife Sanctuary?
The Tipeshwar tiger survey by the Wildlife Institute of India in 2021 estimated about 11 tigers, within a range of 11 to 14, at a density of 7.07 per 100 sq km. Other reports from later years and other methods give different figures, so always check the date and source.
Is Tipeshwar a tiger reserve?
No. Tipeshwar is a wildlife sanctuary of 148.63 sq km, not a notified tiger reserve, though it holds tigers.
How big is Tipeshwar Wildlife Sanctuary?
148.63 sq km, in Pandharkawada tehsil of Yavatmal district, Maharashtra, near the Telangana border.
What animals live in Tipeshwar?
The survey report names tiger, leopard, dhole, Indian wolf, golden jackal, sloth bear, striped hyaena, jungle cat, Bengal fox, honey badger, wild boar, rhesus macaque, langur, sambar, nilgai, chital, four-horned antelope, chinkara, blackbuck and pangolin. It counts about 29 mammal species, around 180 birds and 26 reptiles.
What do tigers eat in Tipeshwar?
The survey measured the prey available, not the diet. Chital and nilgai are the most-recorded prey, and tigers and chital keep very similar active hours, but diet results are not in the report.
Are there gaur in Tipeshwar?
Gaur do not appear in the survey report’s species list, and some travel sources that mention them are not backed by survey data. We follow the Wildlife Institute of India’s list.





